


Analyzing Endpoints With ELK
In this post I will cover my analysis setup in regards to how I have mine configured to capture and consume Sysmon(Windows Logs), Packetbeat, Bro and Procmon. Everyone loves the SysInternals Suite. It comes with an amazing array of analysis tools that have all held the test of time. As with most folks who using the tool suite, Process Monitor is likely in their top 3 favorites. Those that use Procmon regularly likely have their favorite filters and perhaps tools. Many folks use tools like Noriben to get quick hits when running malicious binaries. Noriben is an amazing script that allows you to run Noriben, run your malicious executable and then stop Noriben and review the parsed Procmon output. As always, there’s more than one way to skin a cat.
Since I like using ELK for filtering out some of my analysis, I thought I would take a crack at parsing Procmon with Logstash. Everyone has different setups, so I won’t touch on how you execute Procmon (vmrun), filters you may want to keep local to Procmon or where you save the output, although I will mention saving to a location like a VM shared folder so Logstash or Beats can read is likely ideal.
First things first, my analysis VMs have Sysmon installed, as well as Winlogbeat and Packetbeat. Even though I am running Packetbeat, I also run Bro for some additional traffic details. I won’t cover how to install these because it is pretty dead simple. I will share my ELK configuration files though. As for Procmon, it offers multiple output formats, PML, XML and CSV. Knowing that XML or CSV would likely be the best suited for an ELK setup, I tested playing with both and while XML is doable, it seems to present a lot of unnecessary overhead and Logstash parsing because the XML output is largely filled with data we don’t necessarily need. For this post I will highlight how to use CSV output. If you still want to play with parsing the XML output from Procmon feel free to utilize/tweak the following gist. I find the XML parsing to not be overly reliable, so to me it I landed on leaning on the CSV output.
Before I get into how Procmon, I will cover the easier configurations. Getting Logstash to process incoming Beats data is simple. Just tell Logstash to accept input from the Beats service kicking data out to port 5044 and then send it to Elastic on 9200 and voilà. Packetbeats will send data directly to Logstash and if you configured Winlogbeat to consume Sysmon logs, you should be good to go.
input {
  beats {
    port => 5044
  }
}
output {
  elasticsearch {
    hosts => ["http://localhost:9200"]
    index => "%{[@metadata][beat]}-%{+YYYY.MM.dd}"
    document_type => "%{[@metadata][type]}"
  }
}
Capturing full pcaps is another element I won’t cover here but usually when I am performing analysis in a VM, I capture traffic on my Host and then run Bro against the pcap. I know there are a handful of decent tutorials covering how to parse Bro logs into ELK but since Bro can automatically parse into JSON, I find this method the cleanest and easiest. To enable JSON output simply add the following to be default or execute bro manually to parse out to JSON like so
Under bro/share/bro/site/local.bro add
  @tuning/json-logs
run
  broctl config
  broctl install
Then just run Bro against a pcap
  bro -r some.pcap
or if you want to just tell Bro to parse to JSON when you need it run the following:
  bro -r some.pcap /opt/local/share/bro/policy/tuning/json-logs.bro
From here you can tweak your output into Elastic however you see fit but I’ve found the following config works nicely for me. I will note, I am using the de_dot plugin to assist here. In short, you would capture your pcap and tell Bro to parse the pcap into a JSON log and Logstash will pick it up using something like the following:
input {
  file {
  		type => "bro_logs"
        path => "/Analysis/Pcaps/*.log"
        start_position => beginning
        codec => json
    	sincedb_path => "/var/log/.bro_sincedb"
       }
}

filter {
  date {
    match => [ "ts", "UNIX" ]
    target => "@timestamp"
    remove_field => [ "ts" ]
  }
  if [log_path] == "weird" {
    de_dot {
      fields => [
        "id.orig_p",
        "id.resp_p"
      ]
    }
  }
  if [log_path] == "software" {
    de_dot {
      fields => [
        "version.major",
        "version.minor",
        "version.minor2",
        "version.minor3",
        "version.addl"
      ]
    }
  }
  if [log_path] == "x509" {
    de_dot {
      fields => [
        "certificate.version",
        "certificate.serial",
        "certificate.subject",
        "certificate.issuer",
        "certificate.exponent",
        "certificate.curve",
        "sans.dns",
        "basic_constraints.ca"
      ]
    }
  }
  if [log_path] == "intel" {
    de_dot {
      fields => [
        "seen.indicator",
        "seen.where",
        "seen.node"
      ]
    }
  }
  mutate {
    rename => ["id.orig_p", "src_port"]
    rename => ["id.resp_p", "dst_port"]
    rename => ["id.orig_h", "src_ip"]
    rename => ["id.resp_h", "dst_ip"]
  }
}


output {
  elasticsearch {
    hosts => "localhost"
    index => "bro"
    document_type => "Bro"
  }
}
Since those inputs are in JSON format there isn’t much to them besides tweaking to your liking. Dealing with Procmon’s output takes a hair more tweaking but not much. So let’s break down the config into chunks. Starting with the Input, we need to tell Logstash to look for the Procmon output file csv.
input {
  file {
    path => "/SomeDir/LogFile.CSV"
    start_position => "beginning"
    sincedb_path => "/dev/null"
  }
}
Next we need to set the CSV filter. This part is completely configurable based on your liking. Procmon produces its CSV columns based on what the GUI window is displaying column wise and dependent on what outputs you are viewing. For example, I have my Procmon configured to show the following and in this order. You would adjust this based on what you find useful.
filter {
  csv {
    separator => ","
    ############ CHANGE ###################
    columns => ["Time of Day","Process Name","PID","Operation","Path","Result","Detail","Event Class","Sequence","Image Path","Company","Description","Version","User","Session","Command Line","TID","Virtualized","Integrity","Category","Parent PID"]
    ############## ME ####################
  }
Next, for good measure we need to convert a few field to their appropriate type. I also recommend removing the message field to remove unnecessary clutter.
  mutate {
    convert => {
      "PID"       => "integer"
      "TID"  => "integer"
      "Parent PID" => "integer"
      "Virtualized"  => "boolean"
      "Session" => "integer"
      "Sequence" => "integer"
      "Duration" => "float"
    }
    remove_field => ['message']
  }
Next thing we need to do is get Procmon’s multiple timestamps to work with Elastic’s Joda millisecond timestamps. So we look for the string ‘PM’ in the ‘Time of Day’ field, we remove the last 7 digits to make it work within millisecond time. Then we take the ‘Date & Time’ field and we split it using spaces as the delimiter. Now we add a new field, we call Time and grab the first element from the split and the newly trimmed ‘Time of Day’ and add the string ‘PM’. We then do the same for AM. Lastly we tell Logstash how it should interpret the Time field and we then set that to the @timestamp field.
  if "PM" in [Time of Day]
  {
    mutate {
      gsub => ["Time of Day", ".{7}$", ""]
      split => ["Date & Time", " "]
      add_field => ["Time", "%{[Date & Time][0]} %{[Time of Day]} PM"]
    }
  }
  if "AM" in [Time of Day]
  {
    mutate {
      gsub => ["Time of Day", ".{7}$", ""]
      split => ["Date & Time", " "]
      add_field => ["Time", "%{[Date & Time][0]} %{[Time of Day]} AM"]
    }
  }
  date {
    match => ["Time", "MM/dd/YYYY hh:mm:ss.SSS aa"]
    target => "@timestamp"
  }
Next we need to clean up and adjust the Network Operation events to make it easier for us to query on. First, we filter on Network Events and we split the Path because Procmon lists network source and destination addresses on one line. Then we reference the Operation, trigger on if it says Send or Receive. We then designate the appropriate array element to either the source IP or destination IP depending on the Operation in play.
  if [Event Class] == "Network"
  {
    mutate {
      split => ["Path", "->"]
    }
    if "Send" in [Operation]
      {
        mutate {
          add_field => ["src_ip", "%{[Path][0]}"]
          add_field => ["dst_ip", "%{[Path][1]}"]
        }
      }
    if "Receive" in [Operation]
      {
        mutate {
          add_field => ["dst_ip", "%{[Path][0]}"]
          add_field => ["src_ip", "%{[Path][1]}"]
        }
      }
  }
Lastly, we remove fields no longer needed and send the output to elastic.
  mutate {
    remove_field => ['Time of Day', 'Date & Time', 'Time']
  }
}

output
{
    elasticsearch
    {
        hosts => "localhost"
        index => "logstash-"
        document_type => "Procmon"
    }
stdout {}
}
It will likely help if you push some mappings or reference some mappings within your Logstash config. I find at a minimum listing the src and dst IP as ip is worthwhile.
{
  "mappings": {
    "procmon": {
      "properties": {
        "Version": {
          "type": "text"
        },
        "ip_src": {
          "type": "ip"
        },
        "ip_dst": {
          "type": "ip"
        }
      }
    }
  }
}
Okay, so now that we have the individual Logstash confs we like, we should set them all up into one conf. Here is an example
input {
  beats {
    type => "beats"
    port => 5044
    #codec => json
  }
  file {
    type => "procmon"
    ############ CHANGE ###################
    path => "/ELK/Analysis/LogFile.CSV"
    ############## ME ####################
    start_position => "beginning"
    sincedb_path => "/dev/null"
  }
  file {
    type => "Bro"
    ############ CHANGE ###################
    path => "/ELK/Analysis/Pcap/*.log"
    ############## ME ####################
    start_position => beginning
    codec => json
    sincedb_path => "/dev/null"
  }
}

filter {
  if [type] == "procmon" {
    csv {
      separator => ","
      ############ CHANGE ###################
      columns => ["Time of Day","Process Name","PID","Operation","Path","Result","Detail","Event Class","Sequence","Image Path","Company","Description","Version","User","Session","Command Line","TID","Virtualized","Integrity","Category","Parent PID"]
      ############## ME ####################
    }
    mutate {
      convert => {
        "PID"       => "integer"
        "TID"  => "integer"
        "Parent PID" => "integer"
        "Virtualized"  => "boolean"
        "Session" => "integer"
        "Sequence" => "integer"
        "Duration" => "float"
      }
      remove_field => ['message']
    }
    if "PM" in [Time of Day]
    {
      mutate {
        gsub => ["Time of Day", ".{7}$", ""]
        split => ["Date & Time", " "]
        add_field => ["Time", "%{[Date & Time][0]} %{[Time of Day]} PM"]
      }
    }
    if "AM" in [Time of Day]
    {
      mutate {
        gsub => ["Time of Day", ".{7}$", ""]
        split => ["Date & Time", " "]
        add_field => ["Time", "%{[Date & Time][0]} %{[Time of Day]} AM"]
      }
    }
    date {
      match => ["Time", "MM/dd/YYYY hh:mm:ss.SSS aa"]
      target => "@timestamp"
    }
    if [Event Class] == "Network"
    {
      mutate {
        split => ["Path", "->"]
      }
      if "Send" in [Operation]
        {
          mutate {
            add_field => ["src_ip", "%{[Path][0]}"]
            add_field => ["dst_ip", "%{[Path][1]}"]
          }
        }
      if "Receive" in [Operation]
        {
          mutate {
            add_field => ["dst_ip", "%{[Path][0]}"]
            add_field => ["src_ip", "%{[Path][1]}"]
          }
        }
    }
    mutate {
      remove_field => ['Time of Day', 'Date & Time', 'Time']
    }
  }


  if [type] == "bro-logs" {
    date {
      match => [ "ts", "UNIX" ]
      target => "@timestamp"
      remove_field => [ "ts" ]
    }
    if [log_path] == "weird" {
      de_dot {
        fields => [
          "id.orig_p",
          "id.resp_p"
        ]
      }
    }
    if [log_path] == "software" {
      de_dot {
        fields => [
          "version.major",
          "version.minor",
          "version.minor2",
          "version.minor3",
          "version.addl"
        ]
      }
    }
    if [log_path] == "x509" {
      de_dot {
        fields => [
          "certificate.version",
          "certificate.serial",
          "certificate.subject",
          "certificate.issuer",
          "certificate.exponent",
          "certificate.curve",
          "sans.dns",
          "basic_constraints.ca"
        ]
      }
    }
    if [log_path] == "intel" {
      de_dot {
        fields => [
          "seen.indicator",
          "seen.where",
          "seen.node"
        ]
      }
    }
    mutate {
      rename => ["id.orig_p", "src_port"]
      rename => ["id.resp_p", "dst_port"]
      rename => ["id.orig_h", "src_ip"]
      rename => ["id.resp_h", "dst_ip"]
    }
  }

  if [type] == "beats" {
    mutate {
      rename => ["client_ip", "src_ip"]
      rename => ["source.ip", "src_ip"]
      rename => ["client_port", "src_port"]
      rename => ["source.port", "src_port"]
      rename => ["dest.port", "dst_port"]
      rename => ["port", "dst_port"]
      rename => ["dest.ip", "dst_ip"]
      rename => ["ip", "dst_ip"]
    }
  }
}


output
{
  if [type] == "procmon" {
    elasticsearch {
      hosts => "localhost"
      index => "procmon"
      document_type => "Procmon"
      template => "/Applications/ELK/confs/procmon.mappings"
      template_overwrite => true
    }
  }
  if [type] == "Bro" {
    elasticsearch {
      hosts => "localhost"
      index => "bro"
      document_type => "Bro"
    }
  }
  else {
    elasticsearch {
      hosts => "localhost"
      index => "beats"
      document_type => "Beats"
    }
  }
stdout {}
}
If you want to add something like VirusTotal or SpamHaus lookups to your src or dst IPs? Add a mutate filter to your Logstash conf like so,
mutate {
  add_field => [ "Spamhaus_lookup", "http://www.spamhaus.org/query/bl?ip=%{dst_ip}" ]
}
Okay so now you have a conf that handles Sysmon via Windows Event Log consumption from Winlogbeat, Packet information from Packetbeat, Pcap parsing from Bro output, as well as Procmon parsing. How do you use it all? Your sequence would likely look something like the following: If not already started, you start your ELK stack with your Logstash config looking for Bro and Procmon output. You start your packet capturing for Bro (manually vmrun or script automation), for example you could use tcpdump, tshark or whatever floats your boat. I usually use VMware for no good reason other than it only a Ctrl+R away in my shell history
sudo /Applications/VMware\ Fusion.app/Contents/Library/vmnet-sniffer -e -w blah.pcap vmnet8
Then on your VM or whatever, you start Procmon(can also be started automatically) with whatever config you like (just put the columns you select in your Logstash config), run your evil or suspected evil binary. Stop Procmon and save it as a CSV to the dir Logstash is monitoring. Then you run stop sniffing and run Bro against the pcap
sudo bro -r blah.pcap /opt/local/share/bro/policy/tuning/json-logs.bro
From there you jump into Kibana and start your analysis.
Tools like Noriben and Procmon filters can help you speed up your analysis. Luckily many of these filters and logical queries are easy to do in Kibana. For example, you can easily build a whitelist of hashes, Registry paths, processes or network traffic. You can also perform some logical queries, like only show me the Process Create, SetDispositionInformationFile, Create File, RegCreateKey, RegSetKey, or TCP/UDP events that were marked as SUCCESS? You could run queries like such and then start building repeatable search reports
Result:SUCCESS AND Operation:CreateFile* AND Detail:Created AND !Detail:Opened AND !Path:(\"ProgramData\\\\winlogbeat\\\\\" OR \"Windows\\\\SoftwareDistribution\\\\WuRedir\" OR \"Windows\\\\SoftwareDistribution\\\\SelfUpdate\")
# OR Maybe
_exists_:dest.ip AND _exists_:dest.port AND !dest.port:(445 OR 138 OR 137) AND !dest.ip:(172.* and 224.* and 255.* and 239.*)
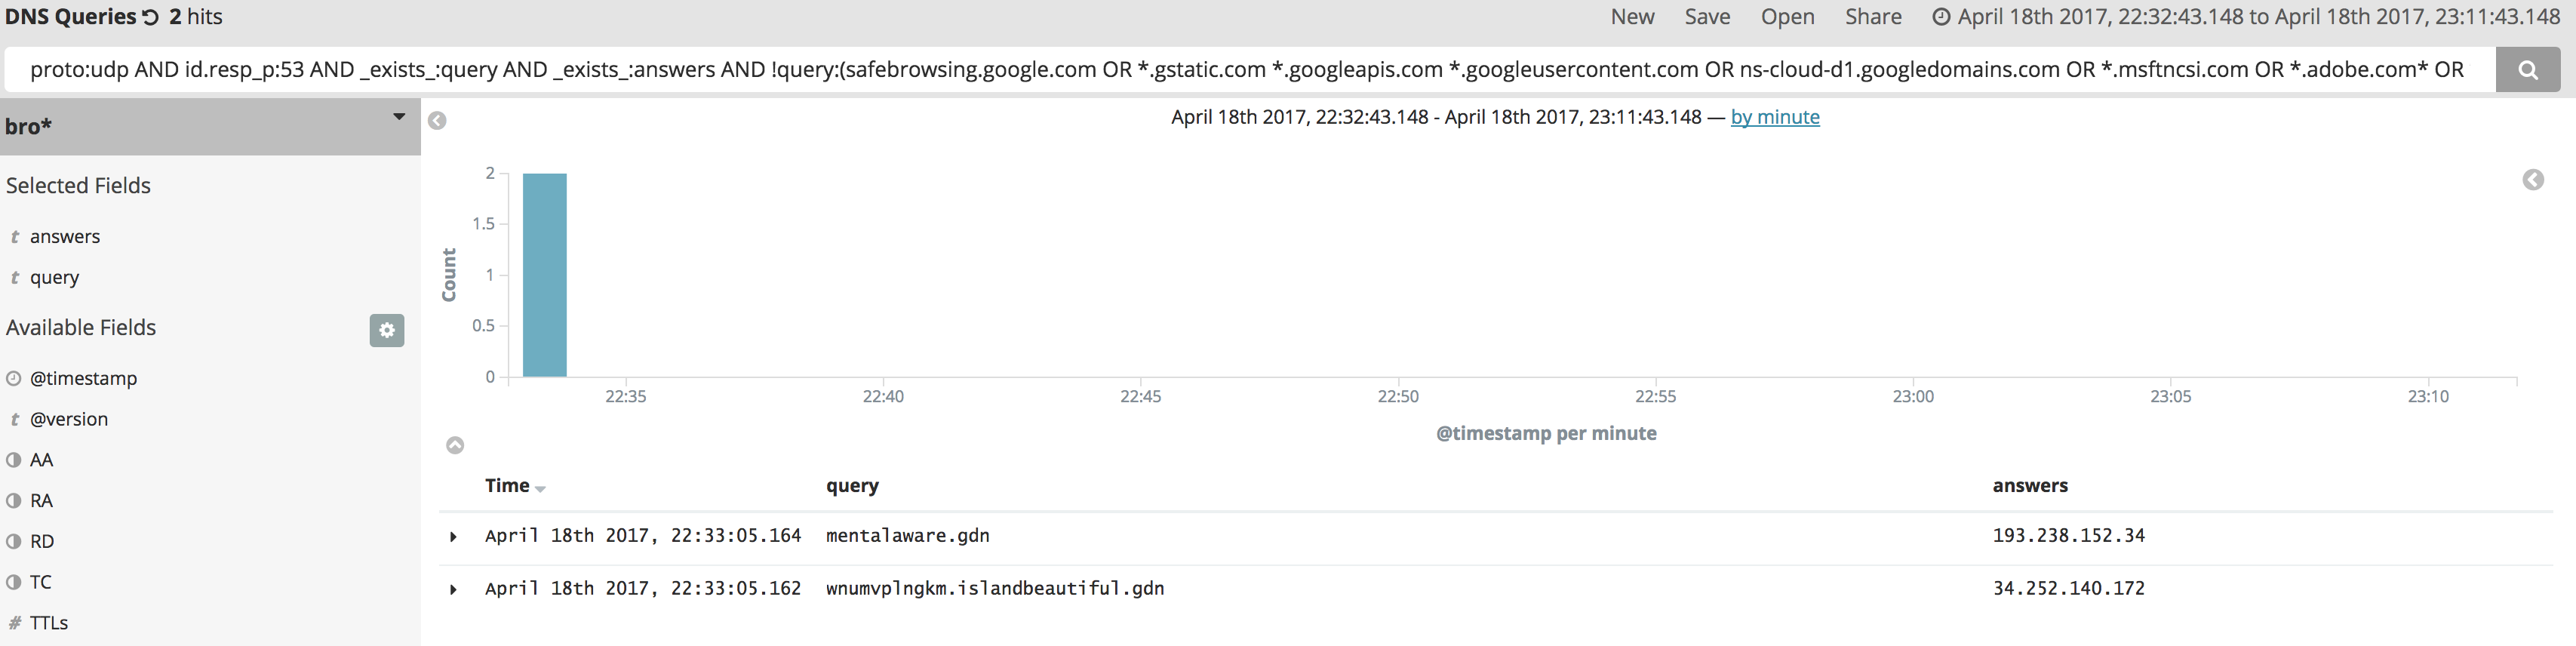
# Or Maybe something like
proto:udp AND id.resp_p:53 AND _exists_:query AND _exists_:answers AND !query:(safebrowsing.google.com OR *.gstatic.com *.googleapis.com *.googleusercontent.com OR ns-cloud-d1.googledomains.com OR *.msftncsi.com OR *.adobe.com* OR *.microsoft.com* OR *.doubleclick.net OR *.windowsupdate.nsatc.net OR oscp.verisign.com OR *.windowsupdate.com OR *.google.com) AND !answers:(*.googleusercontent.com OR *.facebook.com OR *.msftncsi.com OR *.adobe.com OR *.doubleclick.net OR *.windowsupdate.nsatc.net OR safebrowsing.google.com OR *.fbcdn.net OR *.google.com OR *.akamaitechnologies.com)
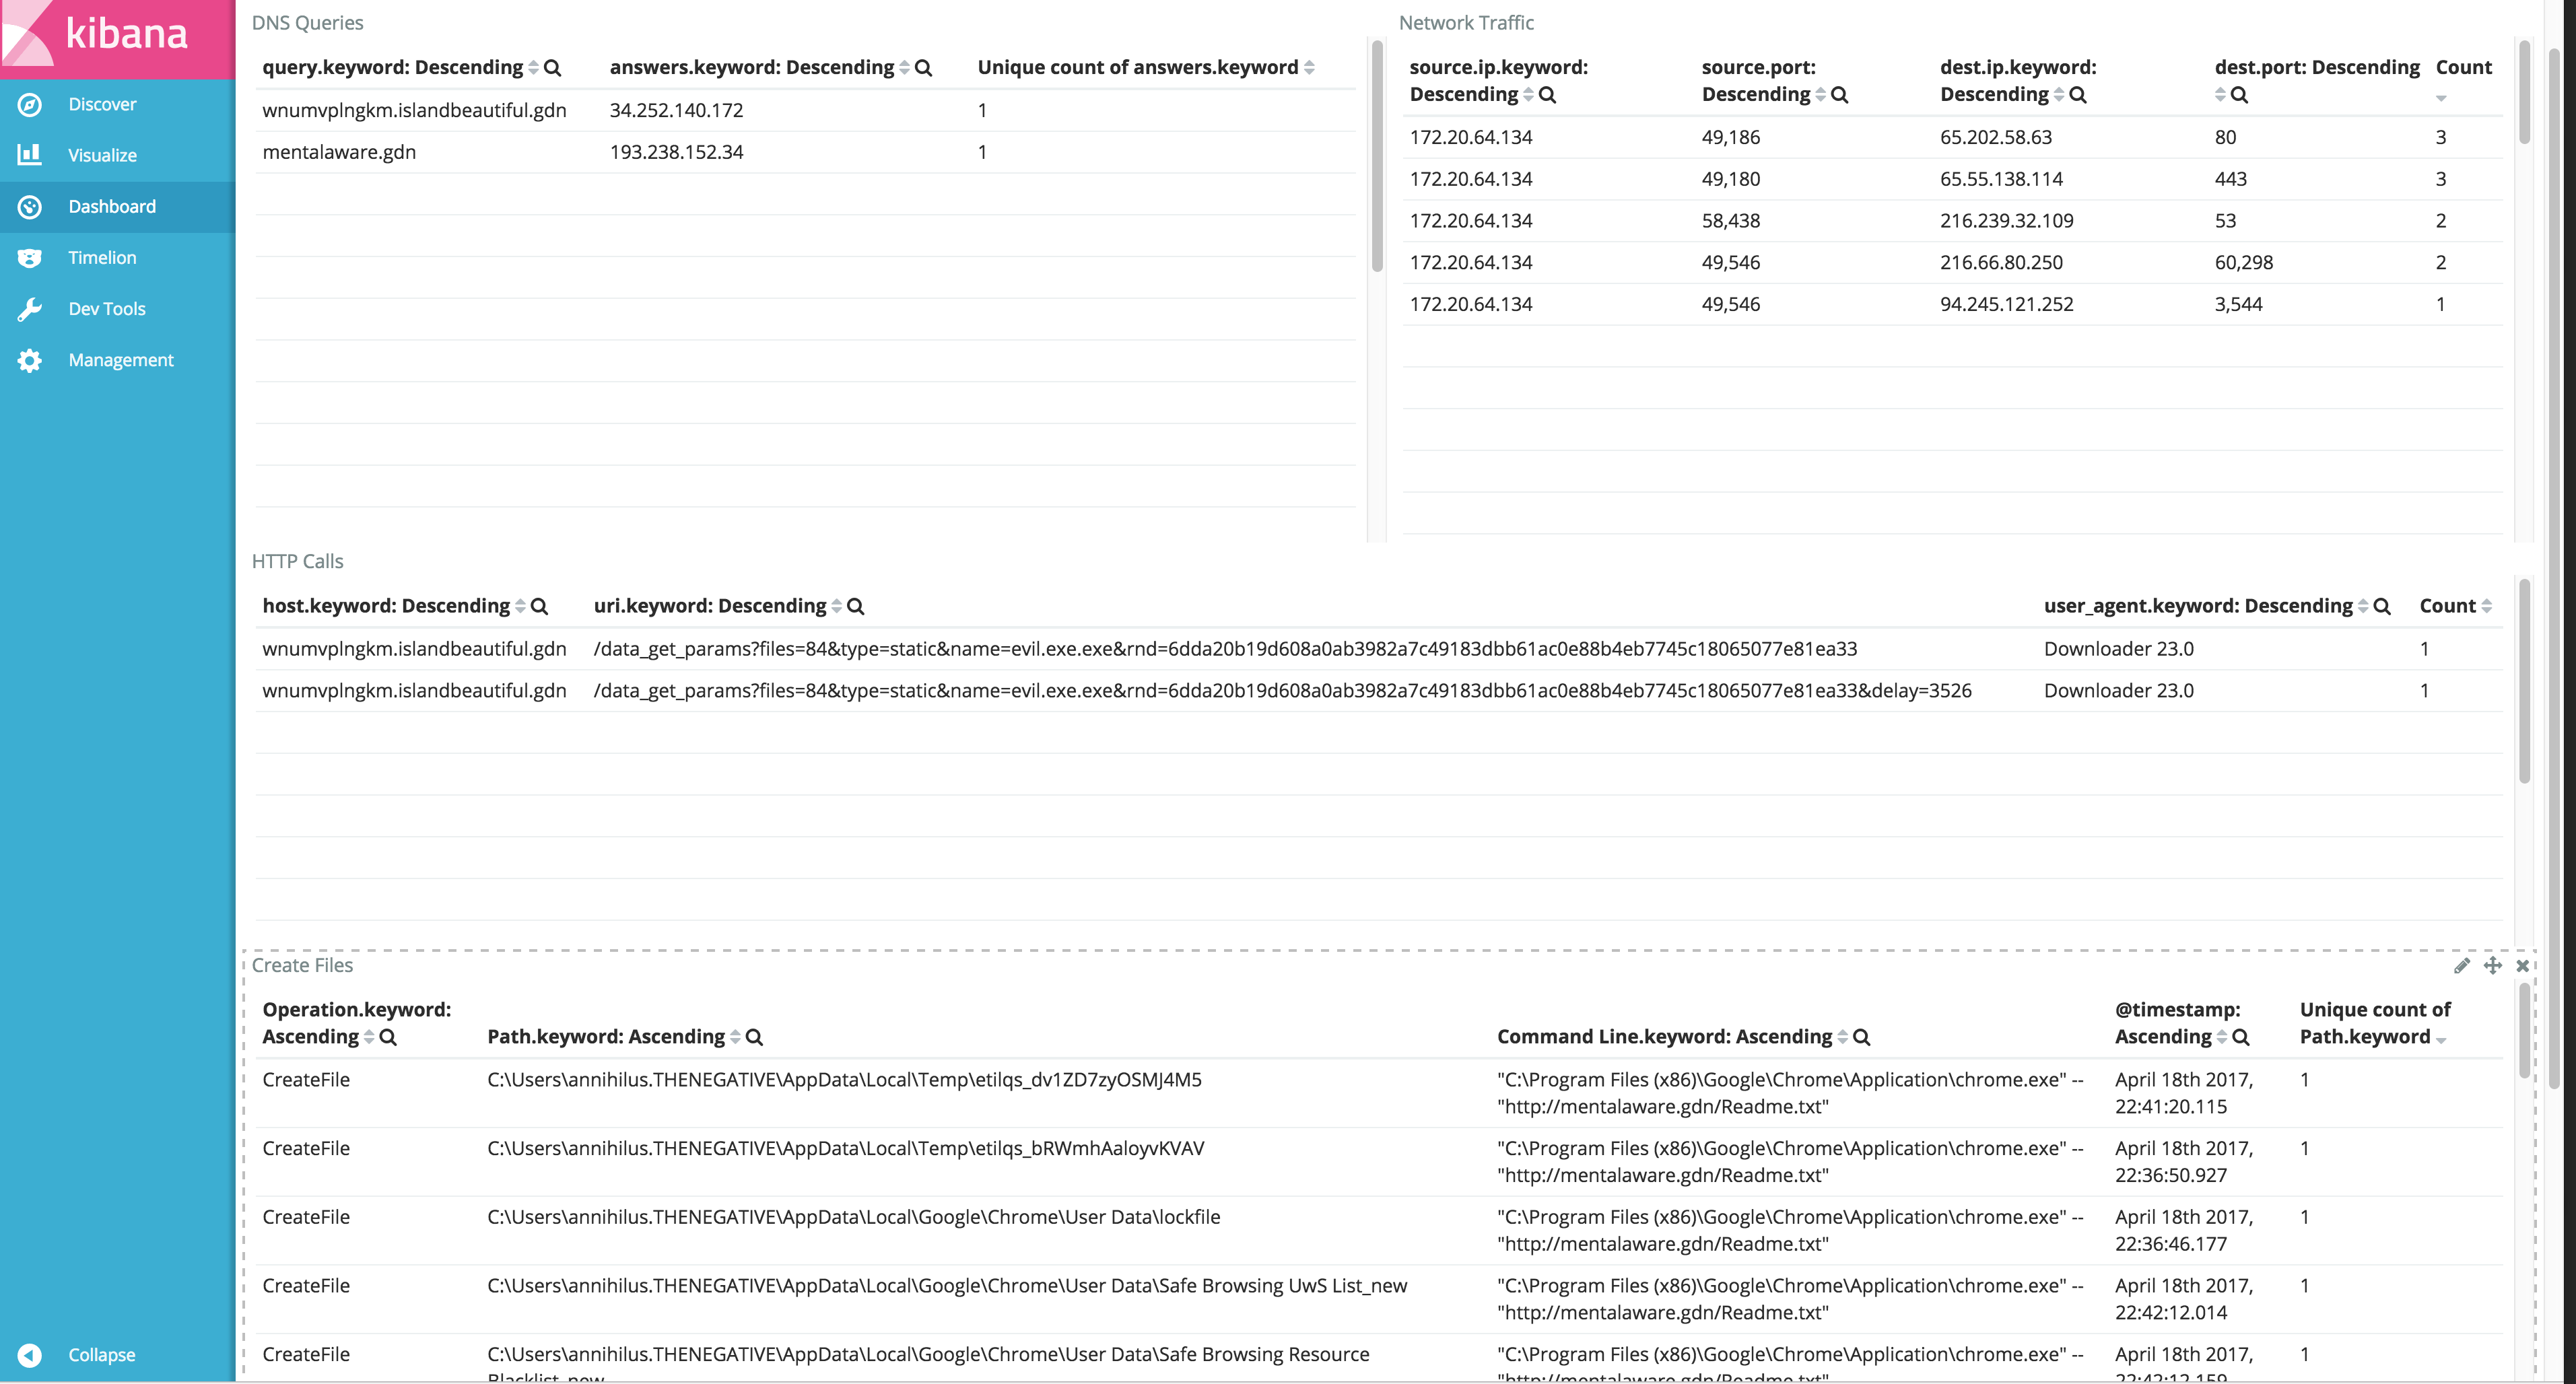
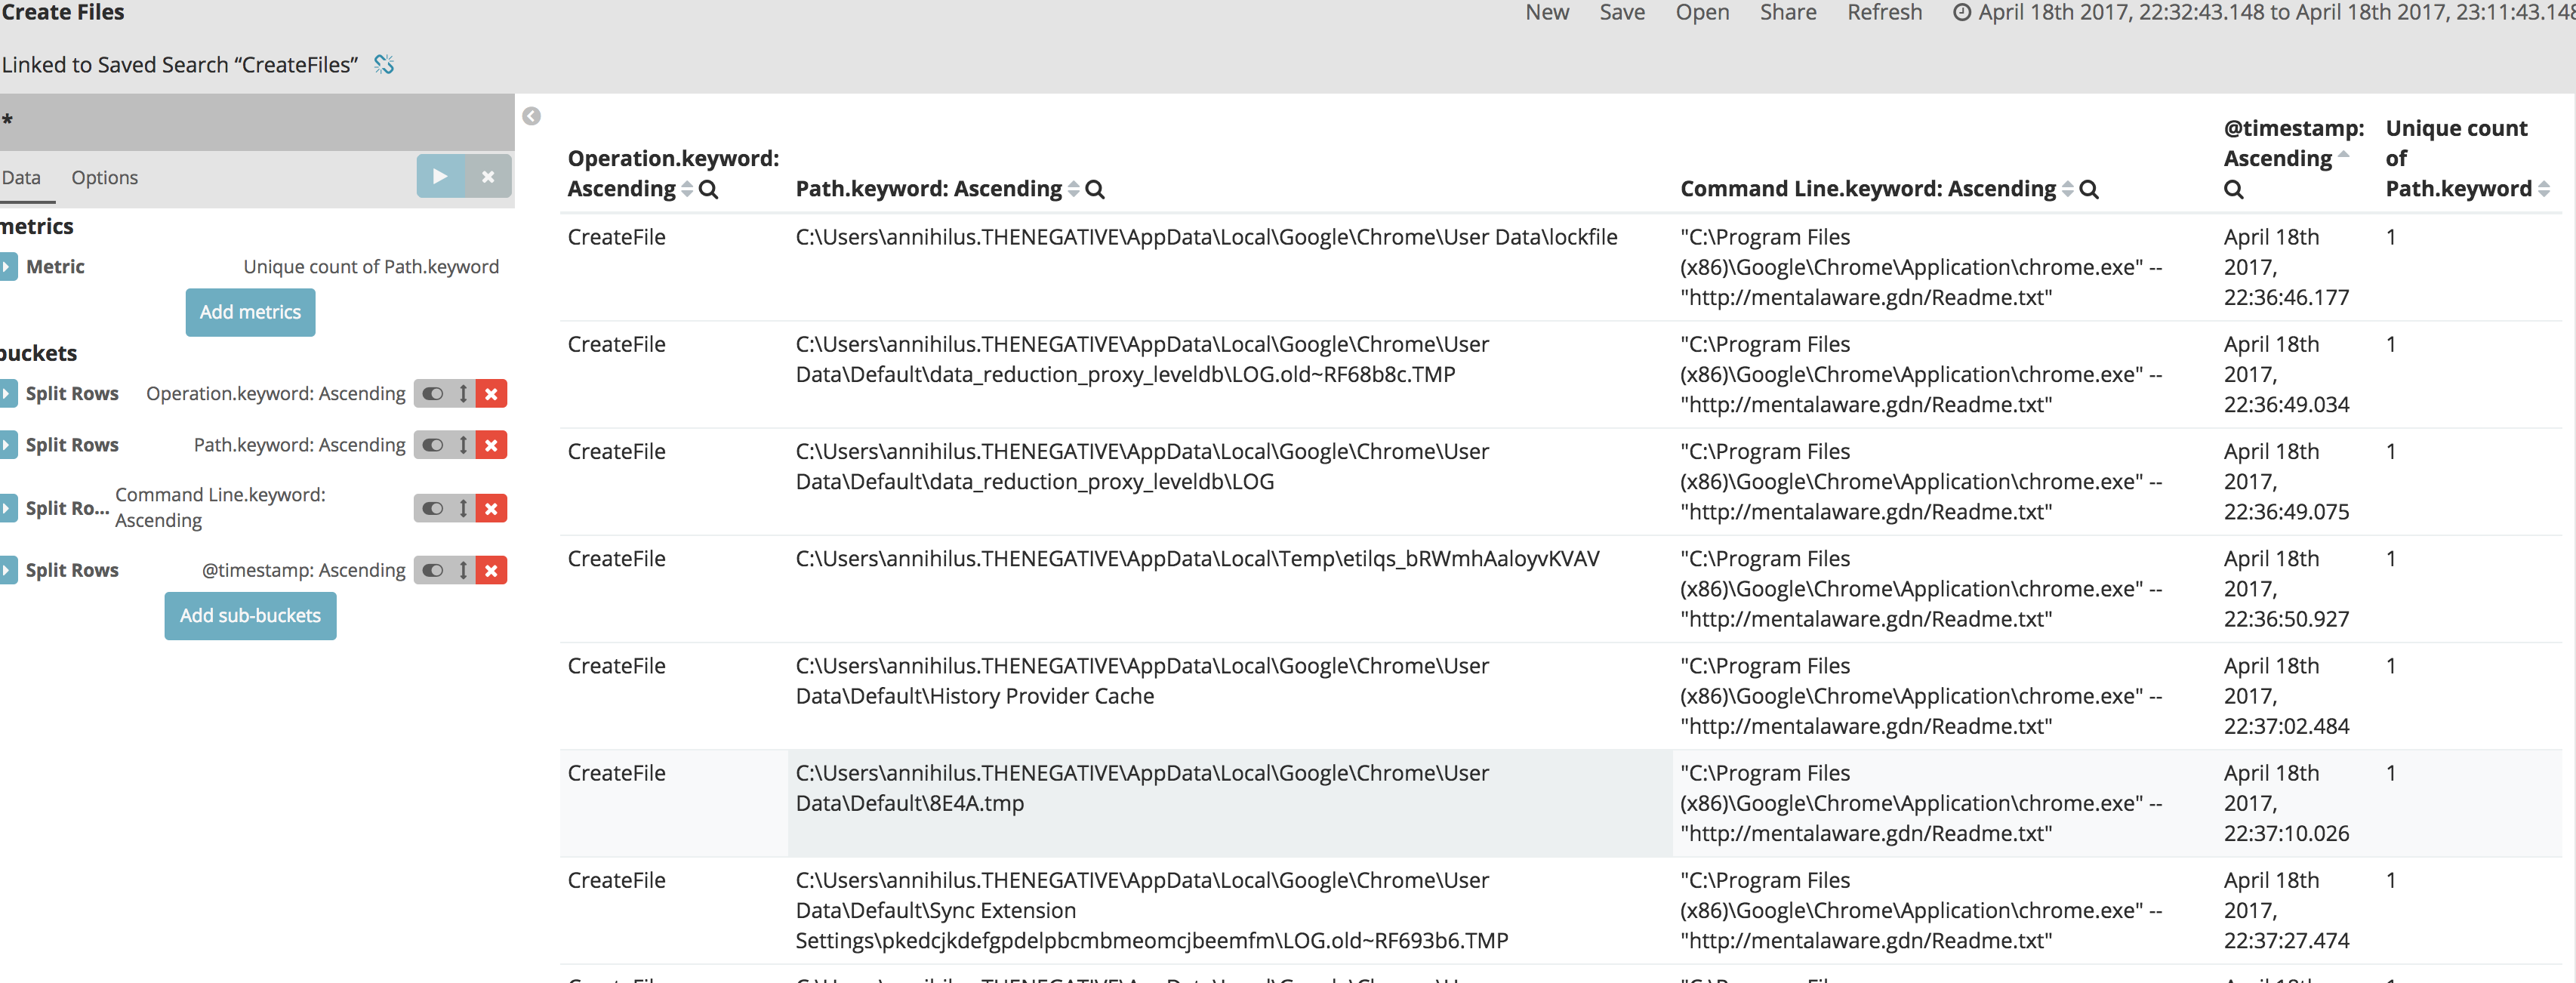 Once you start tweaking your queries to match your preferences you can starting building dashboards to show you event output like tools like Noriben or CaptureBAT.
 If others are using something similar, I would love to hear from them and if you have dashboards or reports you are willing to share, please give me a shout or post them in the comments. Thanks!